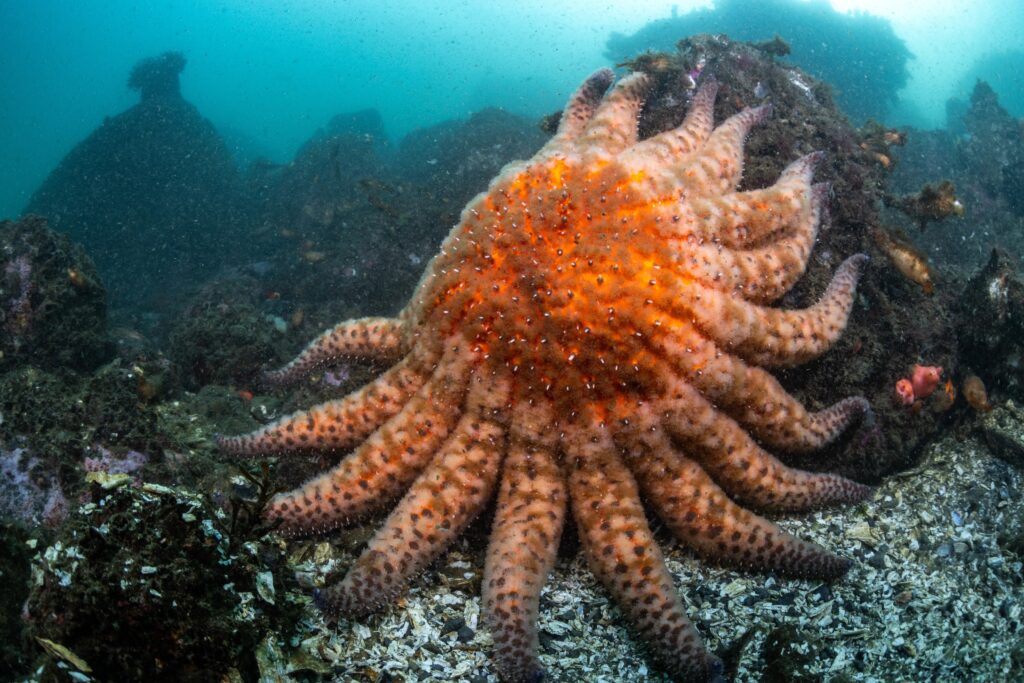

Since its emergence in 2013, sea star wasting disease (SSWD) has quickly spread along the west coast of North America, infecting dozens of sea star species from Mexico to Alaska and upending marine ecosystems. A variety of causes of SSWD have been proposed over the past decade, but no clear cause has been isolated for what is now considered one of the largest marine epidemics. Sunflower sea stars, or Pycnopodia helianthoides, are considered one of the most vulnerable species to SSWD, with billions dying from SSWD since its emergence. Although sunflower sea stars once inhabited the entirety of the west coast of North America, they are now considered functionally extinct in much of their southern range. Over 87% of the population has been lost in the remaining northern areas, earning the species a classification of critically endangered. The large-scale decline of sunflower sea stars due to SSWD has had a cascading effect on ecosystems, in which sea urchin populations have experienced uninhibited growth in the absence of predation. This ecological imbalance has led to the mass destruction of kelp forests and the creation of “urchin barrens” (locations where a previous kelp forest was destroyed by sea urchin overgrazing), demonstrating the profound impact SSWD has on kelp ecosystems and the species that rely on them.
After a series of exposure experiments and genetic sequencing tests of sunflower sea stars infected with SSWD, scientists identified the common bacterium Vibrio pectenicida as a causative agent (a pathogen that directly leads to disease, but may occur under the influence of other environmental or physical conditions) for SSWD. These findings may have lasting impacts on attempts to stem the spread and population losses caused by SSWD, including future efforts to recover the population of sunflower sea stars.
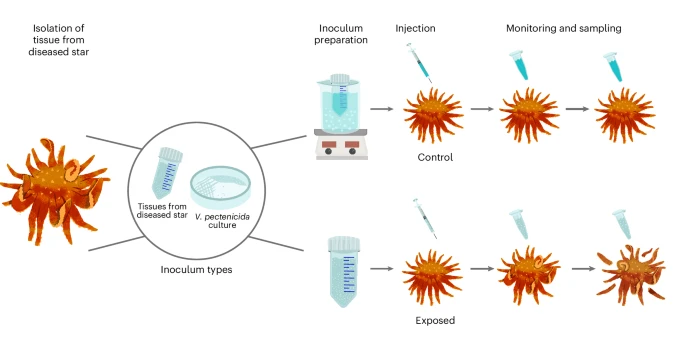
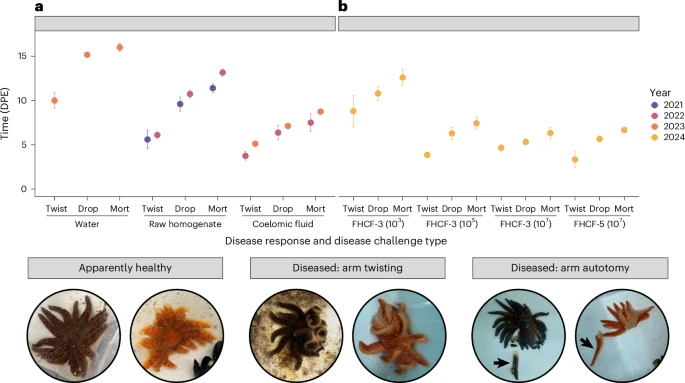
Over the course of three years (2021-2024), scientists conducted a total of seven exposure experiments on sunflower sea stars. Using tissue extracts, coelomic fluid injections (an essential fluid similar to blood for sea stars that circulates immune system cells), and tank water from diseased sunflower sea stars, exposed sea stars were infected with SSWD. Healthy sunflower sea stars were collected in Washington state or raised at Friday Harbor Laboratories, and were first isolated in a 2-week quarantine period to ensure that collected stars did not develop SSWD after potential exposure in the wild. All exposure methods led to transmission of SSWD, with 92% (46/50) of exposed individuals displaying symptoms of SSWD. The disease stages were progressively categorized as “arm twisting,” “arm autonomy,” and “mortality.” Stars exposed to SSWD often died between 6 days to 2 weeks post exposure, usually within a week after showing the first symptoms of the disease.
While using diseased coelomic fluid and tissue sample injections to infect healthy sea stars, scientists also utilized control samples, in which tissues or coelomic fluid from a diseased star were first treated with heat or filtered before injection into a healthy star. All 54 individuals injected with treated samples survived, with limited indications of SSWD. Most sea stars injected with untreated tissue (24 out of 26) or coelomic fluid (16 out of 18) samples from diseased stars contracted SSWD. The dramatic decrease in disease spread after heat treatment indicated that the causative agent (pathogen) of SSWD was likely cellular.
After identifying that the cause of SSWD was likely cellular, scientists genetically sequenced diseased sea star coelomic fluid and tissues from both in-lab sea stars and sea stars at field outbreak sites. Coelomic fluid from healthy stars and stars exposed to SSWD was also collected to contrast the microbes present in sea stars at all disease stages. After RNA and DNA analysis (particularly using 16S ribosomal RNA gene amplicon datasets), the most significant microbial difference between healthy and diseased groups was identified to be the bacterium V. pectenicida (r^2 ≥ 0.90), which was found in abundance in samples from stars with SSWD and was absent in samples from healthy stars. This difference in microbial presence allowed scientists to pinpoint V. pectenicida as a likely causative agent of SSWD. Small bacterial loads of V. pectenicida were found in healthy stars, leading scientists to propose that sea stars can remain healthy with low concentrations of V. pectenicida in ideal environmental conditions. This may indicate that outbreaks occur when environmental conditions (such as increasing temperatures) compromise the star’s immune system and allow the bacterium to flourish.
After genetic sequencing identified V. pectenicida as a candidate for the causative agent of SSWD, scientists conducted a series of exposure experiments using pure V. pectenicida cultures isolated from infected stars. When injected into healthy sea stars, V. pectenicida bacterium strains FHCF-3 and FHCF-5 cultures resulted in SSWD. Healthy sea stars were then injected with high (10^5 colony forming units) and low (10^3 c.f.u.) amounts of V. pectenicida strain FHCF-3 and heat-treated controls. 13 out of 14 stars injected with living bacteria all contracted SSWD and died, while all stars injected with heat treated (dead) bacteria survived. The disease progressed faster in stars injected with a higher concentration of V. pectenicida strain FHCF-3, with mortality occurring 6-11 days post exposure. Meanwhile, the group exposed to a lower concentration of live bacteria progressed through the disease more slowly, with mortality occurring 11-16 days post exposure.
After identifying V. pectenicida as a strong possible cause of SSWD, gene sampling was also conducted at field sites across British Columbia in May and October 2023. Although no individuals sampled at the five sites exhibited signs of SSWD or had V. pectenicida in May, V. pectenicida was identified in two outbreak populations in October. Vibrio pectenicida was found in 16% of healthy stars from visually unaffected sites, 74% of visually normal stars in outbreak sites, and 86% of diseased stars in outbreak sites. The analysis of a genetic database from southeast Alaska in 2016 during an SSWD outbreak also found V. pectenicida in both diseased and normal stars in outbreak sites but not healthy sites, suggesting that V. pectenicida also played a role in past outbreaks of SSWD. Scientists hypothesized that instances of Vibrio pectenicida in apparently disease-free stars may be due to exposure to other diseased stars in the wild.
The discovery of V. pectenicida as a contributing cause of SSWD has strong implications for future research and conservation efforts for struggling sea star populations. V. pectenicida has been found globally (ranging from Australia to Asia to Europe to the US) from 2009-2019 in a variety of marine hosts, particularly in shellfish and bivalve aquaculture. Future research can focus on the mechanism of V. pectenicida as a pathogen, further distinguishing where the bacterium can be found, and modes of transmission both between sea stars and from prey shellfish populations. Scientists proposed that warming oceans due to climate change may make stars more vulnerable to outbreaks of V. pectenicida and other pathogens that thrive in warmer environments, which would support an observed trend between SSWD and warming water temperatures. Since sea stars respond to unfavorable environmental conditions (such as warming water) with similar symptoms to SSWD, it has been difficult to classify SSWD outbreaks. The discovery of V. pectenicida as a causative agent allows researchers to identify V. pectenicida as an indicator of SSWD in sampling, supporting the expansion of sampling across different environments and sea star species. This is essential for continuing to understand SSWD and crafting a response to protect struggling sea star populations and affected ecosystems.
References:
Mazza, Marco. “How Sunflower Stars Can Save California’s Vanishing Kelp Forests.” The Independent, Santa Barbara Independent, 21 June 2024, https://www.independent.com/2024/06/21/how-sunflower-stars-can-save-californias-vanishing-kelp-forests/
Prentice, M.B., Crandall, G.A., Chan, A.M. et al. “Vibrio pectenicida strain FHCF-3 is a causative agent of sea star wasting disease.” Nat Ecol Evol 9, 1739–1751 (2025). https://doi.org/10.1038/s41559-025-02797-2


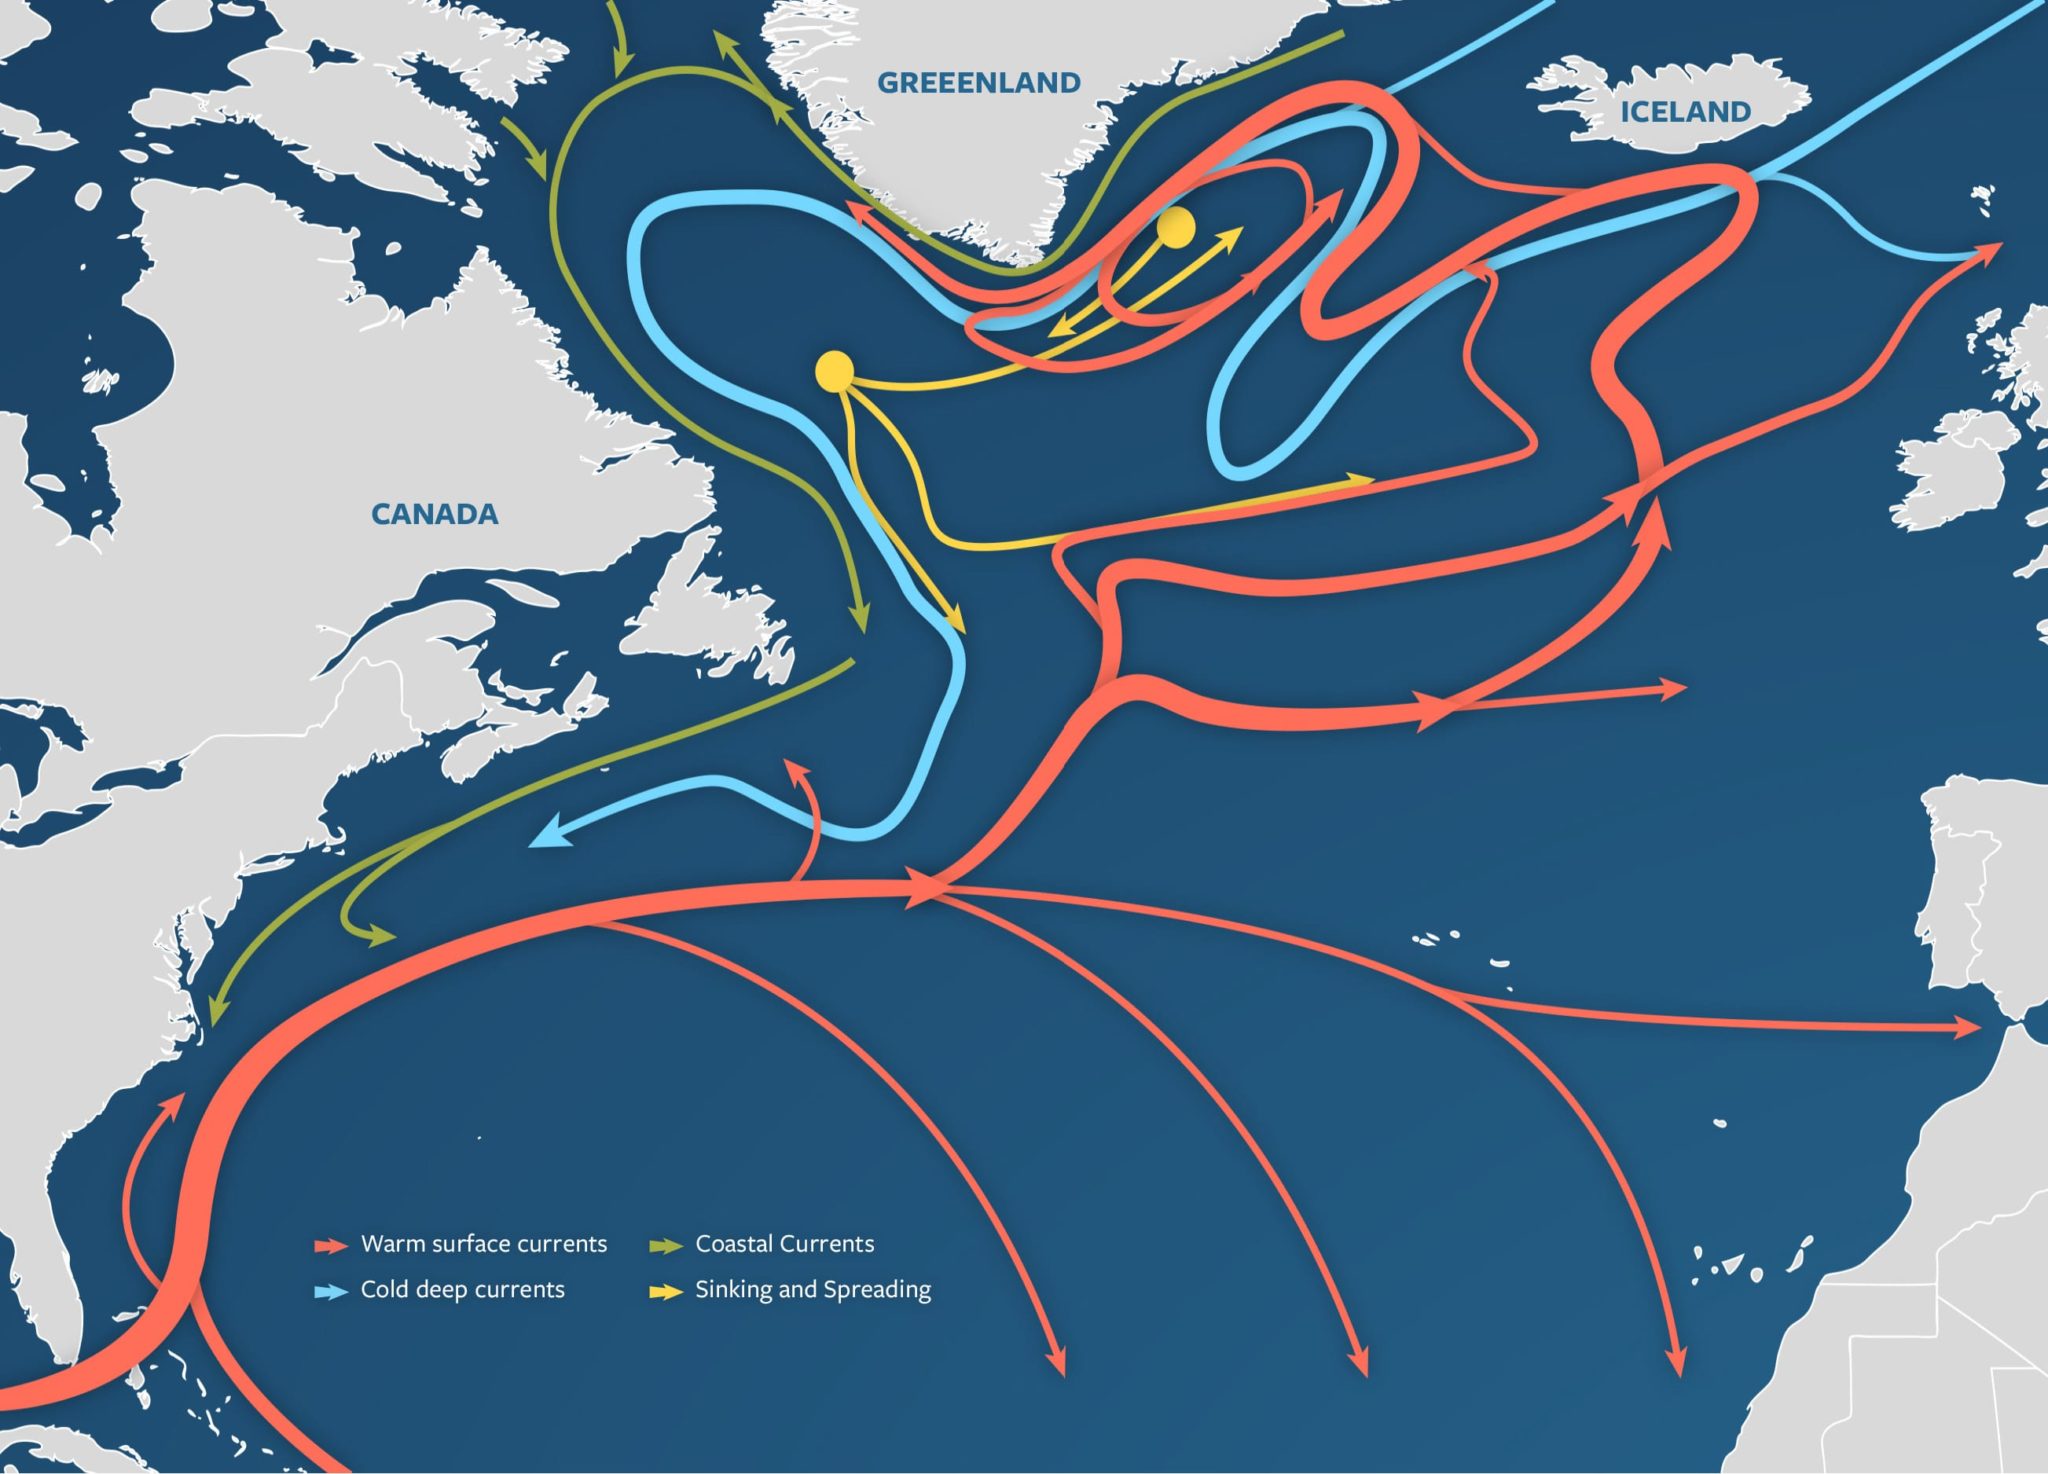 Figure 1: A visualization of the Atlantic Meridional Overturning Circulation (Adapted from “The Ocean Conveyor – Woods Hole Oceanographic Institution,” n.d.).
 Figure 2: AMOC strength at 1000m depth and 26° N latitude. Yellow band shows the range of previously observed AMOC strength (Adapted from Van Westen et al., 2024).
